Wedbush Futures
Market Thoughts -Trump: The Art of the Fed

July 22, 2018, Arthur Bass
With President Trump expressing concern over the possibility of the Fed tightening two more times this year, the question is now whether the Fed will yield to Administration pressure – I think not. Trump’s comments may have the reverse effect of increasing the chances for two moves, as the Fed might feel the need to maintain their independence, although the economic data will be the key determinant for the Fed. It is interesting that markets are now pricing in 92% probability of the Fed moving 25bp in September and 161% probability by December vs 90% and 155% before President Trump spoke.
While futures marked slightly higher probabilities for the Fed tightening, they still lag the Fed’s Dot projections. As seen in the chart below, the Dots from the June meeting project a year end fed funds rate of 2.40%, while FFF9 closed at 2.31%, a difference of 9bp. The difference widens to 43bp by the end of 2019, as the Dots project 3.1% while FFF0 closed at 2.67%, and a 71.5bp difference by year end 2020. Futures markets are currently pricing the tightening cycle to conclude by the end of 2019, and in Eurodollars, reds/greens calendars are now slightly negative. This difference between current markets and the Dots indicate there is room for a sell-off in reds & greens should inflation continue to rise. Core PCE reached 2% last month, and while we have been told there is a symmetrical target, it will be interesting to see how markets react if we start seeing multiple 2%+ numbers.
| Dots 6/13/18 | 2018 | 2019 | 2020 | Longer Run |
| Fed funds rate | 2.4 | 3.1 | 3.4 | 2.9 |
| FFF(19,20,21) | 2.31 | 2.67 | 2.685 | |
| Difference | 0.09 | 0.43 | 0.715 |
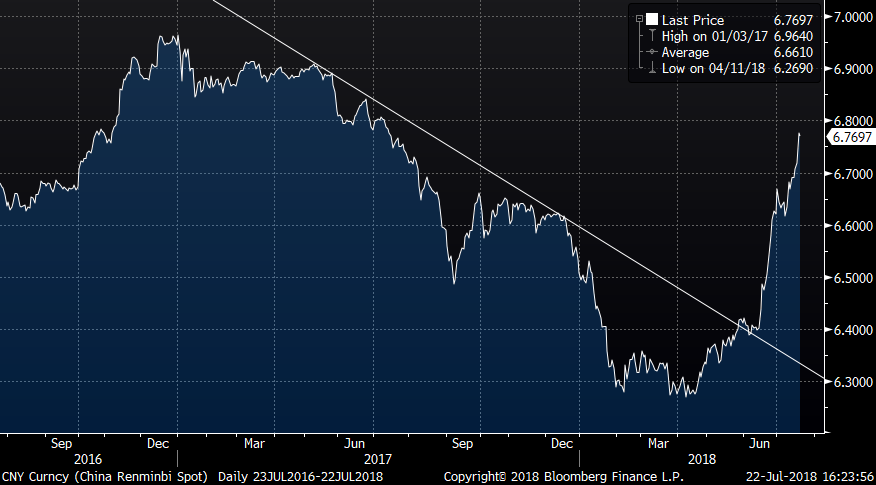
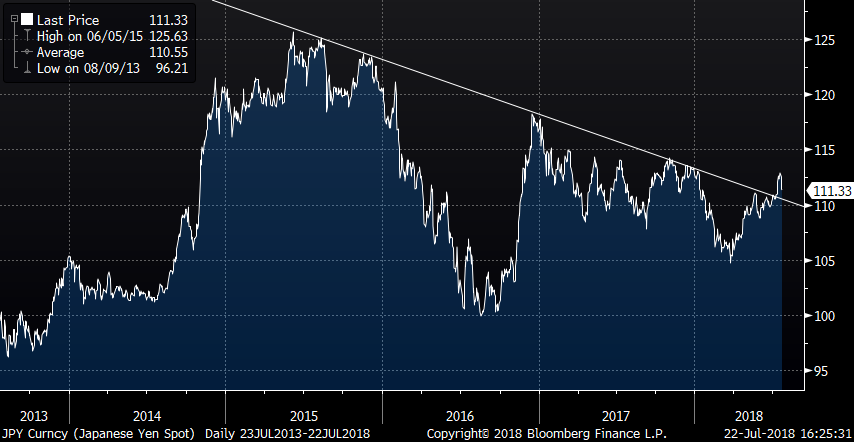
In addition to tariffs and trade barriers, President Trump and Treasury Secretary Mnuchin have also focused on the Chinese Yuan, which has moved from 6.27 to 6.76 to the dollar since April. Note in the chart below, that in addition to the yuan, the Japanese yen is potentially in the midst of a multi-year breakout. With tariffs on the table, currency moves are obviously a hot topic. Interesting historical fact – in 1994 China devalued its currency by 50%, which was one of the main factors supporting its manufacturing ascent, so China is well used to using its currency as an economic tool.
CNY
JPY
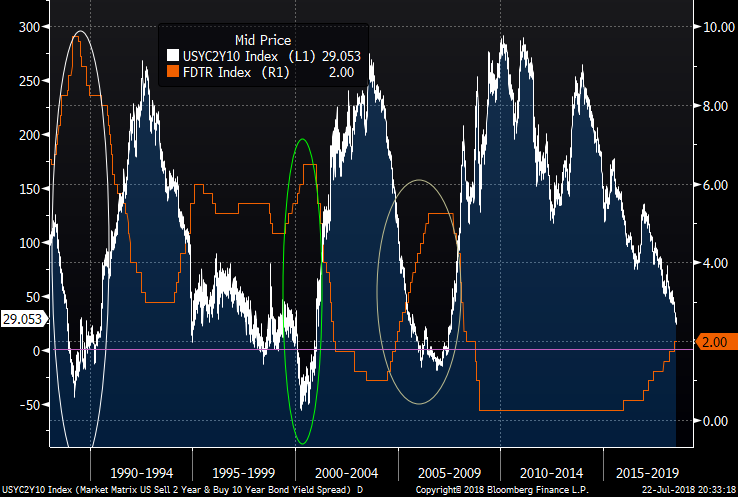
AN INVERTED CURVE HAS NOT STOPPED THE FED FROM TIGHTENING
As seen in the chart below, the Fed tightened in 1989, 2000 and 2006 while the yield curve was inverted. In a way, this should not be surprising as central bank tightening is one of the main elements leading to an inverted curve. The point of the chart is to show that an inverted yield curve by itself will not dissuade the Fed from tightening.
2yr/10yr vs Fed Fund Target
TECHNICALLY, both Eurodollars and Treasuries have traded in a narrow range the past month, but oscillators are turning lower. We had a GAMMA alert signal two weeks ago, which so far has not worked, but we have now gotten a second GAMMA signal.
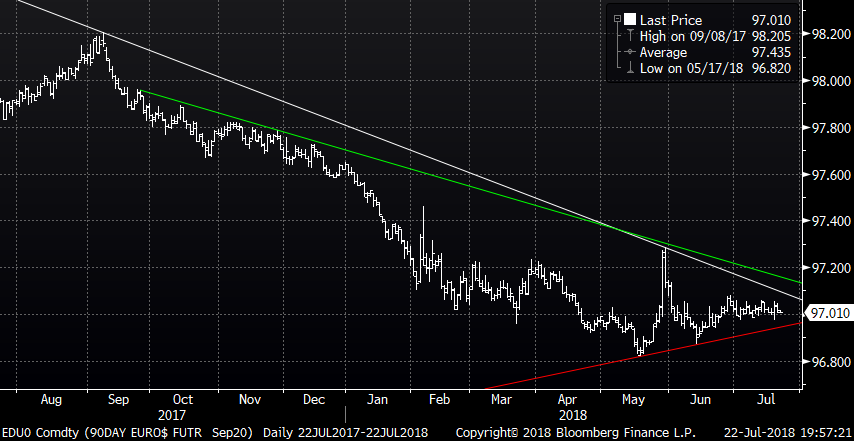
Green Sep Euro$ have traded in a narrow range between 96.87 and 97.08 since early June as strong economic numbers have been offset by concerns over tariffs. While prices have been steady, both stochastics and MACD have turned lower, although RSI is neutral at 50. I am leaning towards prices breaking lower, but would go with a break of either direction.
EDU0
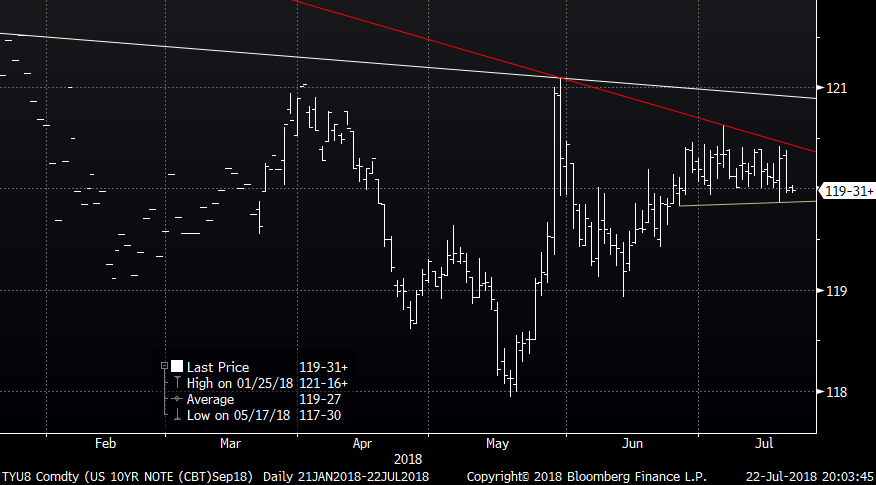
TYU has traded within a one point range for the past month, with a low of 119-20+ and a high of 120-20. RSI is neutral at 49, but similar to green Euro$, oscillators have turned bearish. My feeling is prices will break lower, but I will go with a breakout of the range in either direction.
TYU8
Two Trade ideas we have been watching – for opposite market views:
DOWNSIDE IDEA IN GREEN SEP Euro$
2eu8 96.875/96.625 put spread settles 3.75bp ref 97.01
Green Sep options have almost two months to expiration. The May low in EDU0 was 96.82, and breaking that could certainly lead to a testing of the lower strike. This put spread is a straightforward way to get long downside delta.
FED GO IN SEP/ON HOLD IN DECEMBER TRADES – there are number of variations:
At current fra/ois, if the Fed tightens in September but is on hold in December, EDZ8 would be 97.50. If we price 50% probability of a move in December, EDZ8 would be 97.375.
There has been a great deal of buying in EDZ8 97.375/97.50 call spreads the past few weeks. The key is what to sell against it.
EDZ8 vs EDV8 97.375/97.50 call spread calendar was 0.75/1bp Friday. We originally recommended this trade at 0.5bp and still like it under 1bp. EDV options expire just two and a half weeks after the September FOMC meeting, so assuming at least 50% probability priced in makes sense.
EDZ8 97.375/97.50 vs EDU8 97.50/97.625 call spread calendar– traded @ 0.75bp. A couple hundred thousand of this call spread calendar traded the past few weeks. It is a similar concept, although at current fra/ois, if the Fed goes in September, EDU8 would be 97.52, a couple bp in the money.
If for some reason the Fed is on hold in September, then both call spreads would probably be fully in the money, although EDZ call spread would be 1-2bp under intrinsic, due to time value in the EDZ8 97.50 call. This time value would be slightly less with the EDV expiration as there would be one less month to expiration. For that reason, I like the EDV/EDZ call spread calendar better than the EDU/EDZ.
EDZ8 97.375/97.50 call 1×2 – was .5/1 Friday. This is a low cost trade @ 0.5bp, but there is a risk if the Fed does not tighten in September.
EDZ8 97.375/97.50/97.625 call fly– was 2/2.5 Friday.
One caveat on ratio spreads is the uncertainty of fra/ois.
This information was obtained or gathered from multiple sources that are believed to be reliable. Wedbush Securities, Inc. has not independently verified its accuracy and does not make any representations as to the accuracy or completeness. This information is subject to change without notice and Wedbush Securities, Inc. has no obligation to provide any updates or changes. This material was prepared for and distributed to Institutional Investors or Professional Investors and should not be regarded as research or a research report. This material is provided for informational purposes only and is intended only for your own personal use and does not constitute an invitation to purchase or sell any of the products mentioned herein. In addition, the information is not intended to provide any basis on which to make an investment decision and it may be different from, or inconsistent with, the views of other Wedbush Securities, Inc.’s personnel or the proprietary positions of Wedbush Securities, Inc. Past performance is not a guarantee of future performance and no representation or warranty is made regarding future performance. The risk of loss trading U.S. Treasuries, federal agencies, futures and options on futures can be substantial. An investor can potentially lose all or more than their initial investment so you should carefully evaluate whether U.S. Treasuries, federal agencies, futures and options on futures are suitable considering your own financial condition. If you are unsure, you should seek professional advice. Additional information is available upon request